


CVR Partners Reports Fourth Quarter and Full-Year 2022 Results and Announces a Cash Distribution of $10.50
- Achieved a combined ammonia utilization rate of 96 percent during the fourth quarter of 2022.
- Declared a fourth quarter 2022 cash distribution of
$10.50 per common unit, bringing the cumulative cash distributions declared for 2022 to$24.58 per common unit. - Received upfront proceeds of
$18 million in connection with transactions finalized inJanuary 2023 relating to Section 45Q tax credits.
“CVR Partners reported strong results for the full-year 2022 despite planned turnarounds at both nitrogen fertilizer production facilities,” said
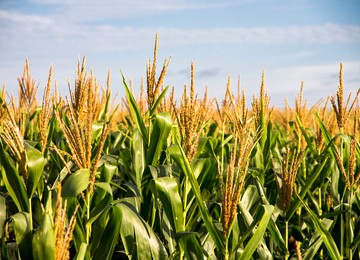
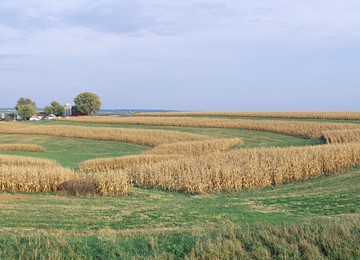
“Grain prices are near 10-year highs and planted corn acres are expected to increase by 3 percent to 5 percent for the spring 2023 planting season, driving strong demand for nitrogen fertilizer,” Pytosh said. “With no planned turnarounds until fall 2024 and the strengthening of our balance sheet completed earlier in 2022, the Partnership will continue to focus on maintaining financial flexibility and generating free cash flow.”
Consolidated Operations
For the fourth quarter of 2022, CVR Partners’ average realized gate prices for UAN improved by 31 percent to
CVR Partners’ fertilizer facilities produced a combined 210,000 tons of ammonia during the fourth quarter of 2022, of which 75,000 net tons were available for sale, while the rest was upgraded to other fertilizer products, including 308,000 tons of UAN. During the fourth quarter of 2021, the fertilizer facilities produced a combined 197,000 tons of ammonia, of which 70,000 net tons were available for sale, while the remainder was upgraded to other fertilizer products, including 288,000 tons of UAN.
For full-year 2022, the average realized gate price for UAN improved by 84 percent to
CVR Partners’ fertilizer facilities produced a combined 703,000 tons of ammonia for full-year 2022, of which 213,000 net tons were available for sale, while the rest was upgraded to other fertilizer products, including 1,140,000 tons of UAN. For full-year 2021, the fertilizer facilities produced a combined 807,000 tons of ammonia, of which 275,000 net tons were available for sale, while the remainder was upgraded to other fertilizer products, including 1,208,000 tons of UAN.
Capital Structure
During the years ended
On
Distributions
Fourth Quarter 2022 Earnings Conference Call
The fourth quarter and full-year 2022 Earnings Conference Call will be webcast live and can be accessed on the Investor Relations section of CVR Partners’ website at www.CVRPartners.com. For investors or analysts who want to participate during the call, the dial-in number is (877) 407-8029. The webcast will be archived and available for 14 days at https://edge.media-server.com/mmc/p/y668oufz. A repeat of the call can be accessed for 14 days by dialing (877) 660-6853, conference ID 13735900.
Qualified Notice
This release serves as a qualified notice to nominees and brokers as provided for under Treasury Regulation Section 1.1446-4(b). Please note that 100 percent of CVR Partners’ distributions to foreign investors are attributable to income that is effectively connected with a
Forward-Looking Statements
This news release contains forward-looking statements. Statements concerning current estimates, expectations and projections about future results, performance, prospects, opportunities, plans, actions and events and other statements, concerns, or matters that are not historical facts are “forward-looking statements,” as that term is defined under the federal securities laws. These forward-looking statements include, but are not limited to, statements regarding future: continued safe and reliable operations; utilization and production rates; proceeds associated with 45Q-related transactions, including the timing and amount thereof; unitholder value; strength of our results and balance sheet; planted corn acres; ability to generate free cash flow; reduction of outstanding debt, including through redemption of outstanding notes, and the impact thereof on interest expense and Partnership financial flexibility; distributions, including the timing, payment and amount (if any) thereof; nitrogen fertilizer pricing and demand; grain prices; crop inventory levels; farmer economics; ammonia and UAN pricing, including improvement thereof; ability to upgrade ammonia to other fertilizer products; purchases under the Unit Repurchase Program (if any), including the timing, pricing and amount thereof; use of funds under the credit facility of the Partnership; direct operating expenses; capital expenditures; depreciation and amortization; turnaround expense and timing; inventories and adjustments thereto; exploration and/or completion of a potential spin-off involving our general partner and the limited partner interests in us owned by
About
Headquartered in
Investors and others should note that
For further information, please contact:
Investor Relations:
(281) 207-3205
InvestorRelations@CVRPartners.com
Media Relations:
(281) 207-3516
MediaRelations@CVRPartners.com
Non-GAAP Measures
Our management uses certain non-GAAP performance measures, and reconciliations to those measures, to evaluate current and past performance and prospects for the future to supplement our financial information presented in accordance with accounting principles generally accepted in
The following are non-GAAP measures we present for the year ended
EBITDA - Net income (loss) before (i) interest expense, net, (ii) income tax expense (benefit) and (iii) depreciation and amortization expense.
Adjusted EBITDA - EBITDA adjusted for certain significant non-cash items and items that management believes are not attributable to or indicative of our on-going operations or that may obscure our underlying results and trends.
Reconciliation of Net Cash Provided By Operating Activities to EBITDA - Net cash provided by operating activities reduced by (i) interest expense, net, (ii) income tax expense (benefit), (iii) change in working capital, and (iv) other non-cash adjustments.
Available Cash for Distribution - EBITDA for the quarter excluding non-cash income or expense items (if any), for which adjustment is deemed necessary or appropriate by the Board in its sole discretion, less (i) reserves for maintenance capital expenditures, debt service and other contractual obligations, and (ii) reserves for future operating or capital needs (if any), in each case, that the Board deems necessary or appropriate in its sole discretion. Available cash for distribution may be increased by the release of previously established cash reserves, if any, and other excess cash, at the discretion of the Board.
We present these measures because we believe they may help investors, analysts, lenders, and ratings agencies analyze our results of operations and liquidity in conjunction with our GAAP results, including, but not limited to, our operating performance as compared to other publicly traded companies in the fertilizer industry, without regard to historical cost basis or financing methods, and our ability to incur and service debt and fund capital expenditures. Non-GAAP measures have important limitations as analytical tools, because they exclude some, but not all, items that affect net earnings and operating income. These measures should not be considered substitutes for their most directly comparable GAAP financial measures. Refer to the “Non-GAAP Reconciliations” included herein for reconciliation of these amounts. Due to rounding, numbers presented within this section may not add or equal to numbers or totals presented elsewhere within this document.
Factors Affecting Comparability of Our Financial Results
Our historical results of operations for the periods presented may not be comparable with prior periods or to our results of operations in the future for the reasons discussed below.
Major Scheduled Turnaround Activities
Coffeyville Facility - A planned turnaround at the Coffeyville Facility commenced in
East Dubuque Facility - A planned turnaround at the East Dubuque Facility commenced in
(unaudited)
Consolidated Statement of Operations Data
| Three Months Ended |
Year Ended |
||||||||||||||
| (in thousands, except per unit data) | 2022 | 2021 | 2022 | 2021 | |||||||||||
| Net sales(1) | $ | 212,233 | $ | 188,921 | $ | 835,584 | $ | 532,581 | |||||||
| Operating costs and expenses: | |||||||||||||||
| Cost of materials and other | 30,602 | 28,371 | 130,913 | 98,345 | |||||||||||
| Direct operating expenses (exclusive of depreciation and amortization) | 51,980 | 60,088 | 270,167 | 198,714 | |||||||||||
| Depreciation and amortization | 19,324 | 20,833 | 82,137 | 73,480 | |||||||||||
| Cost of sales | 101,906 | 109,292 | 483,217 | 370,539 | |||||||||||
| Selling, general and administrative expenses | 8,336 | 7,303 | 32,192 | 26,615 | |||||||||||
| (Gain) loss on asset disposal | (3 | ) | 472 | 263 | 948 | ||||||||||
| Operating income | 101,994 | 71,854 | 319,912 | 134,479 | |||||||||||
| Other income (expense): | |||||||||||||||
| Interest expense, net | (7,825 | ) | (10,414 | ) | (34,065 | ) | (60,978 | ) | |||||||
| Other income, net | 952 | 87 | 1,114 | 4,711 | |||||||||||
| Income before income tax expense | 95,121 | 61,527 | 286,961 | 78,212 | |||||||||||
| Income tax (benefit) expense | (245 | ) | 37 | 160 | 57 | ||||||||||
| Net income | $ | 95,366 | $ | 61,490 | $ | 286,801 | $ | 78,155 | |||||||
| Basic and diluted earnings per common unit | $ | 9.02 | $ | 5.76 | $ | 27.07 | $ | 7.31 | |||||||
| Distributions declared per common unit | 1.77 | 2.93 | 19.32 | 4.65 | |||||||||||
| EBITDA* | $ | 122,270 | $ | 92,774 | $ | 403,163 | $ | 212,670 | |||||||
| Available cash for distribution* | 110,987 | 55,956 | 259,735 | 96,557 | |||||||||||
| Weighted-average common units outstanding: | |||||||||||||||
| Basic and Diluted | 10,570 | 10,681 | 10,593 | 10,685 | |||||||||||
* See “Non-GAAP Reconciliations” section below for a reconciliation of these amounts.
(1) Below are the components of net sales:
| Three Months Ended |
Year Ended |
||||||||||
| (in thousands) | 2022 | 2021 | 2022 | 2021 | |||||||
| Components of net sales: | |||||||||||
| Fertilizer sales | $ | 200,551 | $ | 179,003 | $ | 789,548 | $ | 490,900 | |||
| Freight in revenue | 8,258 | 7,186 | 34,770 | 31,419 | |||||||
| Other | 3,424 | 2,732 | 11,266 | 10,262 | |||||||
| Total net sales | $ | 212,233 | $ | 188,921 | $ | 835,584 | $ | 532,581 | |||
Selected Balance Sheet Data
| (in thousands) | |||||
| Cash and cash equivalents | $ | 86,339 | $ | 112,516 | |
| Working capital | 139,647 | 100,385 | |||
| Total assets | 1,100,402 | 1,127,058 | |||
| Total debt, including current portion | 546,800 | 610,642 | |||
| Total liabilities | 688,591 | 784,860 | |||
| Total partners’ capital | 411,811 | 342,198 | |||
Selected Cash Flow Data
| Three Months Ended |
Year Ended |
||||||||||||||
| (in thousands) | 2022 | 2021 | 2022 | 2021 | |||||||||||
| Net cash flows (used in) provided by: | |||||||||||||||
| Operating activities | $ | (2,771 | ) | $ | 68,458 | $ | 301,464 | $ | 188,725 | ||||||
| Investing activities | (11,222 | ) | (10,136 | ) | (44,623 | ) | (20,342 | ) | |||||||
| Financing activities | (18,709 | ) | (46,474 | ) | (283,018 | ) | (86,426 | ) | |||||||
| Net (decrease) increase in cash and cash equivalents | $ | (32,702 | ) | $ | 11,848 | $ | (26,177 | ) | $ | 81,957 | |||||
Capital Expenditures
| Three Months Ended |
Year Ended |
||||||||||
| (in thousands) | 2022 | 2021 | 2022 | 2021 | |||||||
| Maintenance | $ | 2,141 | $ | 8,803 | $ | 40,793 | $ | 16,226 | |||
| Growth | 51 | 3,356 | 653 | 9,460 | |||||||
| Total capital expenditures | $ | 2,192 | $ | 12,159 | $ | 41,446 | $ | 25,686 | |||
Key Operating Data
Ammonia Utilization (1)
| Three Months Ended |
Year Ended |
||||||||||
| (percent of capacity utilization) | 2022 | 2021 | 2022 | 2021 | |||||||
| Consolidated | 96 | % | 90 | % | 81 | % | 92 | % | |||
(1) Reflects our ammonia utilization rates on a consolidated basis and at each of our facilities. Utilization is an important measure used by management to assess operational output at each of the Partnership’s facilities. Utilization is calculated as actual tons produced divided by capacity. We present our utilization for the three and twelve months ended
Sales and Production Data
| Three Months Ended |
Year Ended |
||||||||||
| 2022 | 2021 | 2022 | 2021 | ||||||||
| Consolidated sales (thousand tons): | |||||||||||
| Ammonia | 77 | 105 | 195 | 269 | |||||||
| UAN | 261 | 265 | 1,144 | 1,196 | |||||||
| Consolidated product pricing at gate (dollars per ton):(1) | |||||||||||
| Ammonia | $ | 967 | $ | 745 | $ | 1,024 | $ | 544 | |||
| UAN | 455 | 347 | 486 | 264 | |||||||
| Consolidated production volume (thousand tons): | |||||||||||
| Ammonia (gross produced)(2) | 210 | 197 | 703 | 807 | |||||||
| Ammonia (net available for sale)(2) | 75 | 70 | 213 | 275 | |||||||
| UAN | 308 | 288 | 1,140 | 1,208 | |||||||
| Feedstock: | |||||||||||
| Petroleum coke used in production(thousand tons) | 127 | 124 | 425 | 514 | |||||||
| Petroleum coke(dollars per ton) | $ | 53.36 | $ | 47.96 | $ | 52.88 | $ | 44.69 | |||
| Natural gas used in production(thousands of MMBtus)(3) | 2,088 | 1,970 | 6,905 | 8,049 | |||||||
| Natural gas used in production(dollars per MMBtu)(3) | $ | 6.68 | $ | 5.43 | $ | 6.66 | $ | 3.95 | |||
| Natural gas in cost of materials and other(thousands of MMBtus)(3) | 2,135 | 2,412 | 6,701 | 7,848 | |||||||
| Natural gas in cost of materials and other(dollars per MMBtu)(3) | $ | 6.30 | $ | 5.10 | $ | 6.37 | $ | 3.83 | |||
(1) Product pricing at gate represents sales less freight revenue divided by product sales volume in tons and is shown in order to provide a pricing measure that is comparable across the fertilizer industry.
(2) Gross tons produced for ammonia represent total ammonia produced, including ammonia produced that was upgraded into other fertilizer products. Net tons available for sale represent ammonia available for sale that was not upgraded into other fertilizer products.
(3) The feedstock natural gas shown above does not include natural gas used for fuel. The cost of fuel natural gas is included in direct operating expense.
Key Market Indicators
| Three Months Ended |
Year Ended |
||||||||||
| 2022 | 2021 | 2022 | 2021 | ||||||||
| Ammonia — Southern plains(dollars per ton) | $ | 1,097 | $ | 1,090 | $ | 1,136 | $ | 681 | |||
| Ammonia — Corn belt(dollars per ton) | 1,272 | 1,199 | 1,274 | 746 | |||||||
| UAN — Corn belt(dollars per ton) | 578 | 583 | 580 | 384 | |||||||
| Natural gas NYMEX(dollars per MMBtu) | $ | 6.07 | $ | 4.84 | $ | 6.54 | $ | 3.73 | |||
Q1 2023 Outlook
The table below summarizes our outlook for certain operational statistics and financial information for the first quarter of 2023. See “Forward-Looking Statements” above.
| Q1 2023 | |||||||
| Low | High | ||||||
| Ammonia utilization rates(1) | |||||||
| Consolidated | 95 | % | 100 | % | |||
| 95 | % | 100 | % | ||||
| 95 | % | 100 | % | ||||
| Direct operating expenses(in millions)(2) | $ | 55 | $ | 65 | |||
| Total capital expenditures(in millions)(3) | $ | 5 | $ | 10 | |||
(1) Direct operating expenses are shown exclusive of depreciation and amortization, turnaround expenses, and impacts of inventory adjustments.
(2) Capital expenditures are disclosed on an accrual basis.
Non-GAAP Reconciliations:
Reconciliation of Net Income to EBITDA and Adjusted EBITDA
| Three Months Ended |
Year Ended |
|||||||||||
| (in thousands) | 2022 | 2021 | 2022 | 2021 | ||||||||
| Net income | $ | 95,366 | $ | 61,490 | $ | 286,801 | $ | 78,155 | ||||
| Interest expense, net | 7,825 | 10,414 | 34,065 | 60,978 | ||||||||
| Income tax (benefit) expense | (245 | ) | 37 | 160 | 57 | |||||||
| Depreciation and amortization | 19,324 | 20,833 | 82,137 | 73,480 | ||||||||
| EBITDA and Adjusted EBITDA | $ | 122,270 | $ | 92,774 | $ | 403,163 | $ | 212,670 | ||||
Reconciliation of
| Three Months Ended |
Year Ended |
||||||||||||||
| (in thousands) | 2022 | 2021 | 2022 | 2021 | |||||||||||
| Net cash (used in) provided by operating activities | $ | (2,771 | ) | $ | 68,458 | $ | 301,464 | $ | 188,725 | ||||||
| Non-cash items: | |||||||||||||||
| Loss on extinguishment of debt | — | (163 | ) | (628 | ) | (8,462 | ) | ||||||||
| Share-based compensation | (6,638 | ) | (7,610 | ) | (25,264 | ) | (23,069 | ) | |||||||
| Other | 148 | (747 | ) | (977 | ) | (3,889 | ) | ||||||||
| Add: | |||||||||||||||
| Interest expense, net | 7,825 | 10,414 | 34,065 | 60,978 | |||||||||||
| Income tax (benefit) expense | (245 | ) | 37 | 160 | 57 | ||||||||||
| Change in assets and liabilities | 123,951 | 22,385 | 94,343 | (1,670 | ) | ||||||||||
| EBITDA and Adjusted EBITDA | $ | 122,270 | $ | 92,774 | $ | 403,163 | $ | 212,670 | |||||||
Reconciliation of EBITDA to Available Cash for Distribution
| Three Months Ended |
Year Ended |
||||||||||||||
| (in thousands) | 2022 | 2021 | 2022 | 2021 | |||||||||||
| EBITDA | $ | 122,270 | $ | 92,774 | $ | 403,163 | $ | 212,670 | |||||||
| Current (reserves) adjustments for amounts related to: | |||||||||||||||
| Net cash interest expense (excluding capitalized interest) | (8,467 | ) | (10,204 | ) | (34,733 | ) | (50,562 | ) | |||||||
| Debt service | — | (15,000 | ) | (65,000 | ) | (30,000 | ) | ||||||||
| Financing fees | — | — | (815 | ) | (4,627 | ) | |||||||||
| Maintenance capital expenditures | (2,141 | ) | (8,804 | ) | (40,793 | ) | (16,226 | ) | |||||||
| Utility pass-through | (675 | ) | (675 | ) | (2,700 | ) | 4,013 | ||||||||
| Common units repurchased | — | — | (12,398 | ) | (529 | ) | |||||||||
| Other (reserves) releases: | |||||||||||||||
| Reserve for recapture of prior negative available cash | — | — | — | (14,980 | ) | ||||||||||
| Future turnaround | — | (4,375 | ) | (16,750 | ) | (10,750 | ) | ||||||||
| Future operating needs | — | — | — | 5,308 | |||||||||||
| Major scheduled expenditures | — | 2,240 | 29,761 | 2,240 | |||||||||||
| Available cash for distribution(1) (2) | $ | 110,987 | $ | 55,956 | $ | 259,735 | $ | 96,557 | |||||||
| Common units outstanding | 10,570 | 10,681 | 10,570 | 10,681 | |||||||||||
(1) Amount represents the cumulative available cash based on quarter-to-date and year-to-date results. However, available cash for distribution is calculated quarterly, with distributions (if any) being paid in the period following declaration.
(2) The Partnership declared and paid cash distributions of

![]()
Source: CVR Partners, LP