


CVR Partners Reports Second Quarter 2019 Results and Announces Cash Distribution of 14 Cents
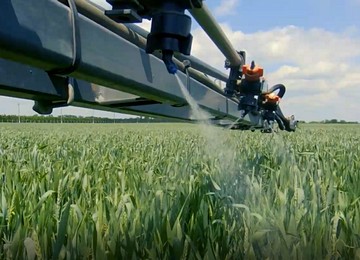
“We continued to experience wet weather across the Midwest during the second quarter of 2019, which impacted the spring planting season and hindered the movement of nitrogen fertilizer across the country,” said
“In addition,
For the second quarter of 2019, CVR Partners’ consolidated average realized gate prices for UAN improved significantly over the prior year, up 14 percent to
CVR Partners’ fertilizer facilities produced a combined 211,000 tons of ammonia during the second quarter of 2019, of which 71,000 net tons were available for sale while the rest was upgraded to other fertilizer products, including 316,000 tons of UAN. In the second quarter of 2018, the fertilizer facilities produced 174,000 tons of ammonia, of which 65,000 net tons were available for sale while the remainder was upgraded to other fertilizer products, including 241,000 tons of UAN.
Distributions
Second Quarter 2019 Earnings Conference Call
The second quarter 2019 Earnings Conference Call will be webcast live and can be accessed on the Investor Relations section of CVR Partners’ website at www.CVRPartners.com. For investors or analysts who want to participate during the call, the dial-in number is (877) 407-8029. The webcast will be archived and available for 14 days at http://edge.media-server.com/mmc/p/9rzqv9co. A repeat of the call also can be accessed for 14 days by dialing (877) 660-6853, conference ID 13692309.
Qualified Notice
This release serves as a qualified notice to nominees and brokers as provided for under Treasury Regulation Section 1.1446-4(b). Please note that 100 percent of CVR Partners’ distributions to foreign investors are attributable to income that is effectively connected with a
Forward-Looking Statements
This news release contains forward-looking statements. Statements concerning current estimates, expectations and projections about future results, performance, prospects, opportunities, plans, actions and events and other statements, concerns, or matters that are not historical facts are “forward-looking statements,” as that term is defined under the federal securities laws. These forward-looking statements include, but are not limited to, statements regarding future: distributions including the timing, payment and variations thereof; operating performance; product prices; reserves; capital expenditures; continued safe and reliable operations; and other matters. You can generally identify forward-looking statements by our use of forward-looking terminology such as “outlook,” “anticipate,” “believe,” “continue,” “could,” “estimate,” “expect,” “intend,” “may,” “might,” “plan,” “potential,” “predict,” “seek,” “should,” or “will,” or the negative thereof or other variations thereon or comparable terminology. These forward-looking statements are only predictions and involve known and unknown risks and uncertainties, many of which are beyond our control. Investors are cautioned that various factors may affect these forward-looking statements, including (among others) impacts of planting season on our business, general economic and business conditions and other risks. For additional discussion of risk factors which may affect our results, please see the risk factors and other disclosures included in our most recent Annual Report on Form 10-K, any subsequently filed Quarterly Reports on Form 10-Q and our other
About
Headquartered in
For further information, please contact:
Investor Contact:
(281) 207-3205
InvestorRelations@CVRPartners.com
Media Relations:
(281) 207-3516
MediaRelations@CVRPartners.com
Non-GAAP Measures
Our management uses certain non-GAAP performance measures, and reconciliations to those measures, to evaluate current and past performance and prospects for the future to supplement our GAAP financial information presented in accordance with U.S. GAAP. These non-GAAP financial measures are important factors in assessing our operating results and profitability and include the performance and liquidity measures defined below.
The following are non-GAAP measures presented for the period ended June 30, 2019:
EBITDA - Net income (loss) before (i) interest expense, net, (ii) income tax expense (benefit) and (iii) depreciation and amortization expense.
Adjusted EBITDA - EBITDA adjusted to exclude turnaround expense which management believes is material to an investor’s understanding of the Partnership’s underlying operating results.
Reconciliation of Net Cash Provided By (Used in) Operating Activities to EBITDA - Net cash provided by (used in) operating activities reduced by (i) interest expense, net, (ii) income tax expense (benefit), (iii) change in working capital, and (iv) other non-cash adjustments.
Available Cash for Distribution - Adjusted EBITDA reduced for cash reserves established by the board of directors of our general partner for (i) debt service, (ii) maintenance capital expenditures, (iii) turnaround expenses and, to the extent applicable, (iv) reserves for future operating or capital needs that the board of directors of our general partner deems necessary or appropriate, if any, in its sole discretion. Available cash for distribution may be increased by the release of previously established cash reserves, if any, and other excess cash, at the discretion of the board of directors of our general partner.
We present these measures because we believe they may help investors, analysts, lenders and ratings agencies analyze our results of operations and liquidity in conjunction with our U.S. GAAP results, including but not limited to our operating performance as compared to other publicly traded companies in the refining industry, without regard to historical cost basis or financing methods and our ability to incur and service debt and fund capital expenditures. Non-GAAP measures have important limitations as analytical tools, because they exclude some, but not all, items that affect net earnings and operating income. These measures should not be considered substitutes for their most directly comparable U.S. GAAP financial measures. See “Non-GAAP Reconciliations” section included herein for reconciliation of these amounts. Due to rounding, numbers presented within this section may not add or equal to numbers or totals presented elsewhere within this document.
| CVR Partners, LP |
|||||||||||||||
| (all information in this release is unaudited) |
|||||||||||||||
| Financial and Operational Data | |||||||||||||||
| Three Months Ended June 30, | Six Months Ended June 30, | ||||||||||||||
| (in thousands, except per unit data) | 2019 | 2018 | 2019 | 2018 | |||||||||||
| Consolidated Statement of Operations Data | |||||||||||||||
| Net sales (a) | $ | 137,660 | $ | 93,197 | $ | 229,533 | $ | 173,056 | |||||||
| Operating costs and expenses: | |||||||||||||||
| Cost of materials and other | 26,000 | 19,139 | 49,730 | 41,608 | |||||||||||
| Direct operating expenses (exclusive of depreciation and amortization) | 45,630 | 47,465 | 80,450 | 86,134 | |||||||||||
| Depreciation and amortization | 25,030 | 20,405 | 41,614 | 36,831 | |||||||||||
| Cost of sales | 96,660 | 87,009 | 171,794 | 164,573 | |||||||||||
| Selling, general and administrative expenses | 6,465 | 6,900 | 13,311 | 12,562 | |||||||||||
| (Gain) loss on asset disposals | (9 | ) | 78 | 445 | 132 | ||||||||||
| Operating income (loss) | 34,544 | (790 | ) | 43,983 | (4,211 | ) | |||||||||
| Other income (expense): | |||||||||||||||
| Interest expense, net | (15,599 | ) | (15,677 | ) | (31,249 | ) | (31,388 | ) | |||||||
| Other income, net | 35 | 27 | 55 | 71 | |||||||||||
| Net income (loss) before income taxes | 18,980 | (16,440 | ) | 12,789 | (35,528 | ) | |||||||||
| Income tax expense (benefit) | 12 | 19 | (100 | ) | (18 | ) | |||||||||
| Net income (loss) | $ | 18,968 | $ | (16,459 | ) | $ | 12,889 | $ | (35,510 | ) | |||||
| Basic and diluted earnings per unit data | $ | 0.17 | $ | (0.15 | ) | $ | 0.11 | $ | (0.31 | ) | |||||
| Distributions declared per unit data | 0.07 | — | 0.19 | — | |||||||||||
| Adjusted EBITDA* | $ | 59,760 | $ | 25,979 | $ | 85,803 | $ | 39,095 | |||||||
| Available Cash for Distribution* | 15,297 | — | 23,146 | (4,139 | ) | ||||||||||
| Weighted-average common units outstanding - basic and diluted | 113,283 | 113,283 | 113,283 | 113,283 | |||||||||||
| __________________________ * See “Non-GAAP Reconciliations” section below for a reconciliation of these amounts. |
|||||||||||||||
| (a) Below are the components of net sales: | |||||||||||||||
| Three Months Ended June 30, | Six Months Ended June 30, | ||||||||||||||
| (in thousands) | 2019 | 2018 | 2019 | 2018 | |||||||||||
| Reconciliation to net sales: | |||||||||||||||
| Fertilizer sales | $ | 128,502 | $ | 84,703 | $ | 210,589 | $ | 153,974 | |||||||
| Freight in revenue | 7,139 | 6,364 | 15,157 | 15,103 | |||||||||||
| Other | 2,019 | 2,130 | 3,787 | 3,979 | |||||||||||
| Total net sales | $ | 137,660 | $ | 93,197 | $ | 229,533 | $ | 173,056 | |||||||
| Selected Balance Sheet Data |
|||||||||||||||
| (in thousands) | June 30, 2019 |
December 31, 2018 | |||||||||||||
| Cash and cash equivalents | $ | 69,266 |
$ | 61,776 | |||||||||||
| Working capital | 97,755 | 71,346 | |||||||||||||
| Total assets | 1,190,405 | 1,254,388 | |||||||||||||
| Total long-term debt | 630,655 | 628,989 | |||||||||||||
| Total liabilities | 699,213 | 754,562 | |||||||||||||
| Total partners’ capital | 491,192 | 499,826 | |||||||||||||
| Selected Cash Flow Data | |||||||||||||||
| Three Months Ended June 30, | Six Months Ended June 30, | ||||||||||||||
| (in thousands) | 2019 | 2018 | 2019 | 2018 | |||||||||||
| Net cash flow (used in) provided by: | |||||||||||||||
| Operating activities | $ | (17,243 | ) | $ | (26,956 | ) | $ | 34,681 | $ | (12,470 | ) | ||||
| Investing activities | (2,168 | ) | (5,903 | ) | (5,668 | ) | (8,451 | ) | |||||||
| Financing activities | (7,929 | ) | — | (21,523 | ) | — | |||||||||
| Net (decrease) increase in cash and cash equivalents | $ | (27,340 | ) | $ | (32,859 | ) | $ | 7,490 | $ | (20,921 | ) | ||||
| Capital Expenditures | |||||||||||||||
| Three Months Ended June 30, | Six Months Ended June 30, | ||||||||||||||
| (in thousands) | 2019 | 2018 | 2019 | 2018 | |||||||||||
| Maintenance capital expenditures | $ | 1,684 | $ | 5,668 | $ | 4,502 | $ | 9,030 | |||||||
| Growth capital expenditures | 288 | 1,745 | 303 | 2,198 | |||||||||||
| Total capital expenditures | $ | 1,972 | $ | 7,413 | $ | 4,805 | $ | 11,228 | |||||||
| Key Operating Data | |||||
| Ammonia Utilization Rates (1) | |||||
| Two Years Ended June 30, | |||||
| (percent of capacity utilization) | 2019 | 2018 | |||
| Consolidated | 92% | 94% | |||
| Coffeyville | 94% | 93% | |||
| East Dubuque | 90% | 95% | |||
| __________________________________ (1) Reflects our ammonia utilization rates on a consolidated basis and at each of our facilities. Utilization is an important measure used by management to assess operational output at each of the Partnership’s facilities. Utilization is calculated as actual tons produced divided by capacity. We present our utilization on a two-year rolling average to take into account the impact of our current turnaround cycles on any specific period. The two-year rolling average is a more useful presentation of the long-term utilization performance of our plants. Additionally, we present utilization solely on ammonia production rather than each nitrogen product as it provides a comparative baseline against industry peers and eliminates the disparity of plant configurations for upgrade of ammonia into other nitrogen products. With our efforts being primarily focused on ammonia upgrade capabilities, this measure provides a meaningful view of how well we operate. |
|||||
| Sales and Production Data | ||||||||||||||
| Three Months Ended June 30, | Six Months Ended June 30, | |||||||||||||
| 2019 | 2018 | 2019 | 2018 | |||||||||||
| Consolidated sales (thousand tons): | ||||||||||||||
| Ammonia | 110 | 82 | 146 | 118 | ||||||||||
| UAN | 340 | 270 | 628 | 615 | ||||||||||
| Consolidated product pricing at gate (dollars per ton) (2): | ||||||||||||||
| Ammonia | $ | 456 | $ | 348 | $ | 434 | $ | 340 | ||||||
| UAN | 217 | 191 | 219 | 169 | ||||||||||
| Consolidated production volume (thousand tons): | ||||||||||||||
| Ammonia (gross produced) (3) | 211 | 174 | 390 | 373 | ||||||||||
| Ammonia (net available for sale) (3) | 71 | 65 | 112 | 124 | ||||||||||
| UAN | 316 | 241 | 651 | 580 | ||||||||||
| Feedstock: | ||||||||||||||
| Petroleum coke used in production (thousand tons) | 134 | 90 | 266 | 208 | ||||||||||
| Petroleum coke used in production (dollars per ton) | $ | 34.6 | $ | 25.33 | $ | 36.14 | $ | 21.34 | ||||||
| Natural gas used in production (thousands of MMBtus) (4) | 2,070 | 1,964 | 3,510 | 3,814 | ||||||||||
| Natural gas used in production (dollars per MMBtu) (4) | $ | 2.61 | $ | 2.78 | $ | 3.11 | $ | 3 | ||||||
| Natural gas in cost of materials and other (thousands of MMBtus) (4) | 3,185 | 2,571 | 4,193 | 3,829 | ||||||||||
| Natural gas in cost of materials and other (dollars per MMBtu) (4) | $ | 3.32 | $ | 2.84 | $ | 3.45 | $ | 3.05 | ||||||
| _________________________ (2) Product pricing at gate represents sales less freight revenue divided by product sales volume in tons and is shown in order to provide a pricing measure that is comparable across the fertilizer industry. |
||||||||||||||
| (3) Gross tons produced for ammonia represent total ammonia produced, including ammonia produced that was upgraded into other fertilizer products. Net tons available for sale represent ammonia available for sale that was not upgraded into other fertilizer products. | ||||||||||||||
| (4) The feedstock natural gas shown above does not include natural gas used for fuel. The cost of fuel natural gas is included in direct operating expense. | ||||||||||||||
| Key Market Indicators | |||||||||||||||
| Three Months Ended June 30, | Six Months Ended June 30, | ||||||||||||||
| 2019 | 2018 | 2019 | 2018 | ||||||||||||
| Ammonia - Southern plains (dollars per ton) | $ | 382 | $ | 343 | $ | 404 | $ | 362 | |||||||
| Ammonia - Corn belt (dollars per ton) | 495 | 396 | 496 | 412 | |||||||||||
| UAN - Corn belt (dollars per ton) | 226 | 211 | 228 | 211 | |||||||||||
| Natural gas NYMEX (dollars per MMBtu) | $ | 2.51 | $ | 2.83 | $ | 2.69 | $ | 2.84 | |||||||
| Non-GAAP Reconciliations | |||||||||||||||
| Reconciliation of Net Income (Loss) to EBITDA and Adjusted EBITDA | |||||||||||||||
| Three Months Ended June 30, | Six Months Ended June 30, | ||||||||||||||
| (in thousands) | 2019 | 2018 | 2019 | 2018 | |||||||||||
| Net income (loss) | $ | 18,968 | 0 | $ | (16,459 | ) | $ | 12,889 | $ | (35,510 | ) | ||||
| Add: | |||||||||||||||
| Interest expense, net | 15,599 | 15,677 | 31,249 | 31,388 | |||||||||||
| Income tax (benefit) | 12 | 19 | (100 | ) | (18 | ) | |||||||||
| Depreciation and amortization | 25,030 | 20,405 | 41,614 | 36,831 | |||||||||||
| EBITDA | $ | 59,609 | $ | 19,642 | $ | 85,652 | $ | 32,691 | |||||||
| Add: | |||||||||||||||
| Major turnaround expense | $ | 151 | $ | 6,337 | $ | 151 | $ | 6,404 | |||||||
| Adjusted EBITDA | $ | 59,760 | $ | 25,979 | $ | 85,803 | $ | 39,095 | |||||||
| Reconciliation of Net Cash Provided By Operating Activities to EBITDA | |||||||||||||||
| Three Months Ended June 30, | Six Months Ended June 30, | ||||||||||||||
| (in thousands) | 2019 | 2018 | 2019 | 2018 | |||||||||||
| Net cash (used in) provided by operating activities | $ | (17,243 | ) | $ | (26,956 | ) | $ | 34,681 | $ | (12,470 | ) | ||||
| Add: | |||||||||||||||
| Interest expense, net | 15,599 | 15,677 | 31,249 | 31,388 | |||||||||||
| Income tax (benefit) | 12 | 19 | (100 | ) | (18 | ) | |||||||||
| Change in working capital | 63,246 | 32,988 | 24,148 | 17,042 | |||||||||||
| Other non-cash adjustments | (2,005 | ) | (2,086 | ) | (4,326 | ) | (3,251 | ) | |||||||
| EBITDA | $ | 59,609 | $ | 19,642 | $ | 85,652 | $ | 32,691 | |||||||
| Reconciliation of Adjusted EBITDA to Available Cash for Distribution | |||||||||||||||
| Three Months Ended June 30, | Six Months Ended June 30, | ||||||||||||||
| (in thousands) | 2019 | 2018 | 2019 | 2018 | |||||||||||
| Adjusted EBITDA | $ | 59,760 | $ | 25,979 | $ | 85,803 | $ | 39,095 | |||||||
| Less: | |||||||||||||||
| Debt service | (14,865 | ) | (14,870 | ) | (29,692 | ) | (29,790 | ) | |||||||
| Maintenance capital expenditures | (1,447 | ) | (4,098 | ) | (4,814 | ) | (6,366 | ) | |||||||
| Turnaround expenses | (151 | ) | (6,337 | ) | (151 | ) | (6,404 | ) | |||||||
| Reserve for East Dubuque turnaround | (7,000 | ) | — | (7,000 | ) | — | |||||||||
| Reserve for maintenance capital expenditures | (16,000 | ) | — | (16,000 | ) | — | |||||||||
| Cash reserves for future operating needs | (5,000 | ) | (674 | ) | (5,000 | ) | (674 | ) | |||||||
| Available Cash for Distribution (1) | $ | 15,297 | $ | — | $ | 23,146 | $ | (4,139 | ) | ||||||
| Common units outstanding (in thousands) | 113,283 | 113,283 | 113,283 | 113,283 | |||||||||||
| ________________________________________ (1) Amount represents the cumulative Available Cash based on quarter-to-date and year-to-date results, respectively. However, Available Cash for distribution is calculated quarterly, with distributions (if any) being paid in the following period. |
|||||||||||||||
![]()
Source: CVR Partners, LP